DashboardDashboard
Trang Dashboard là tổng quan thống kê của tenant: tổng user, tổng điểm đã cộng, số sự kiện, đổi thưởng, phân bố hạng, top user và điểm theo từng rule. Dùng để theo dõi nhanh hoạt động gamification. Thuộc module Client Admin.
Ai sử dụng
Dùng bởi Client Admin (quản trị tenant) sau khi đăng nhập bằng JWT.
Sử dụng như thế nào
Vào từ sidebar Client Admin → Dashboard (thường là trang mặc định sau khi đăng nhập). Xem các thẻ thống kê, biểu đồ phân bố hạng, top user, điểm theo rule — không cần thao tác; chỉ xem để đánh giá tình hình. Liên quan: Event Logs, Users, Event Types.
Ý nghĩa các field trên màn hình Dashboard
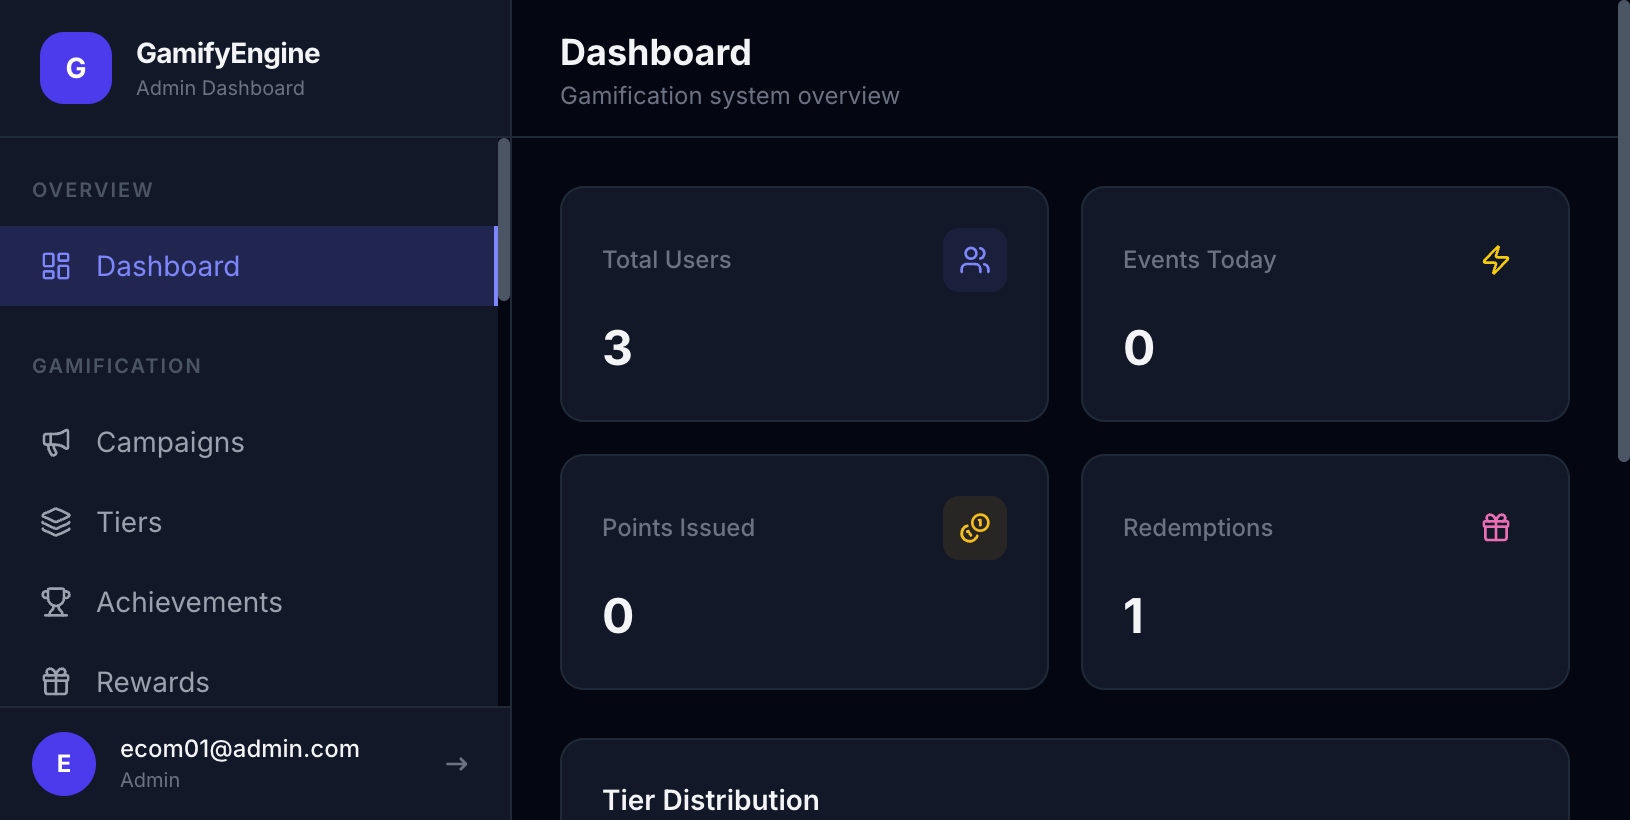
1. Bốn thẻ thống kê (stat cards)
| Field | Ý nghĩa |
|---|---|
| Total Users | Tổng số user (người chơi) của tenant — đếm tất cả user đã được tạo (Identify hoặc từ event) và chưa bị xóa. Phản ánh quy mô người dùng đang tham gia gamification. |
| Events Today / Events (30 ngày) | Số lượng sự kiện (event) mà hệ thống đã nhận trong khoảng thời gian (hôm nay hoặc 30 ngày qua, tùy backend). Mỗi lần app/website gửi event (vd. deposit_made, login) qua SDK hoặc API được tính là 1 event. Số cao cho thấy người dùng tương tác nhiều và rule đang chạy. |
| Points Issued | Tổng điểm đã cộng cho user (có thể tính toàn thời gian hoặc trong 30 ngày qua, tùy API). Là tổng lifetime_earned hoặc tổng điểm từ các rule/transaction trong kỳ. Cho biết “độ nóng” của việc trao thưởng điểm. |
| Redemptions | Tổng số lần user đổi điểm lấy reward (đổi thưởng). Mỗi lần user redeem một phần thưởng (từ catalog) được tính 1 redemption. Phản ánh hiệu quả catalog và mức độ dùng điểm. |
2. Tier Distribution (Phân bố theo hạng)
Biểu đồ/ danh sách cho biết số user thuộc từng tier (Bronze, Silver, Gold, … hoặc “No Tier”). Mỗi dòng: tên hạng, số user, có thể kèm phần trăm. Giúp xem cấu trúc user theo hạng và điều chỉnh điều kiện lên hạng nếu cần.
3. Top Users (Top người chơi)
Danh sách user có điểm tích lũy (lifetime earned) cao nhất trong tenant. Mỗi dòng thường hiển thị: thứ hạng, external_id (hoặc tên hiển thị), tier, tổng điểm đã kiếm. Dùng để nhanh chóng thấy “power users” và có thể dùng cho leaderboard, ưu đãi.
4. Points by rule (Điểm theo rule — 30 ngày)
Bảng thống kê theo từng rule: mỗi rule (cộng điểm khi thỏa điều kiện) có số giao dịch (transaction count) và tổng điểm đã cộng trong 30 ngày qua. Giúp biết rule nào đang “chạy” nhiều, rule nào cộng nhiều điểm — để tối ưu hoặc tắt bớt rule.
Dashboard tổng quan Client Admin.
The Dashboard page is the tenant stats overview: total users, points awarded, event counts, redemptions, tier distribution, top users, and points by rule. Use it to quickly monitor gamification activity. Part of Client Admin.
Who uses it
Used by Client Admin (tenant administrator) after logging in with JWT.
How to use
Go to Client Admin sidebar → Dashboard (often the default page after login). View stat cards, tier distribution, top users, points by rule — read-only; use it to assess activity. Related: Event Logs, Users, Event Types.
Meaning of the fields on the Dashboard screen
1. Four stat cards
| Field | Meaning |
|---|---|
| Total Users | Total number of users (players) for the tenant — all created users (via Identify or from events) that are not deleted. Reflects the size of the user base in the gamification system. |
| Events Today / Events (30 days) | Number of events received by the system in the period (today or last 30 days, depending on the backend). Each time the app/website sends an event (e.g. deposit_made, login) via SDK or API counts as one event. A high number indicates strong user interaction and rules firing. |
| Points Issued | Total points awarded to users (all-time or last 30 days, depending on the API). Sum of lifetime_earned or points from rules/transactions in the period. Shows how much points are being awarded. |
| Redemptions | Total number of times users have redeemed points for rewards. Each redemption of a catalog reward counts as one. Reflects how much the reward catalog is used and how engaged users are with redeeming. |
2. Tier Distribution
Chart or list showing how many users are in each tier (Bronze, Silver, Gold, … or “No Tier”). Each row: tier name, user count, and optionally percentage. Helps you see the user structure by tier and adjust tier upgrade conditions if needed.
3. Top Users
List of users with the highest lifetime earned points in the tenant. Each row typically shows: rank, external_id (or display name), tier, and total points earned. Use it to quickly see “power users” for leaderboards or special offers.
4. Points by rule (last 30 days)
Table of stats per rule: for each rule (award points when conditions are met), the number of transactions and total points awarded in the last 30 days. Helps you see which rules are firing most and which award the most points — so you can optimize or disable rules.
Client Admin dashboard overview.